
CUDA Kernels Zero to One
learn basics of gpu programming and writing custom cuda kernels

Throughput and Latency
throughput means how many operations can we do per second and latency means how much time does one operation take. cpu optimizes latency, while gpu’s optimizes throughput
two primary components on the chip are ALU ( unit of computation ) and Control/Caches.
cpu prioritizes control on chip to decrease latency while gpu prioritizes ALU’s to increase throughput
The NVIDIA A100 GPU has 6,912 FP32 ALUs
Because the GPU removed the complex caches and control logic, individual GPU threads are actually slower (higher latency) than CPU threads. If a GPU thread needs to fetch data from memory, it waits a long time (relative to the clock speed). but it covers it via parallism
physical structure of a GPU
a gpu is divided in many SM’s (Streaming Multiprocessors)
Each SM is a self-contained processor. An SM has its own instruction scheduler, its own registers (fast local memory), and its own shared memory (cache)
Because SMs are independent, hardware scaling is straightforward. If NVIDIA wants to make a faster GPU, they print more SMs on the silicon.
NVIDIA A100: Has 108 SMs.
NVIDIA H100: Has 132 SMs.
Inside every SM, there are the actual execution units that perform the math. We call these ALUs (Arithmetic Logic Units) or “Cores.”
In modern NVIDIA architectures (like Ampere, used in the A100), an SM contains several types of specialized cores:
FP64 cores: 32 per SM; used for scientific double-precision work
FP32 cores: 64 per SM, 108 SMs → 6912 total; used for normal 32-bit math
Tensor Cores: 4 per SM; do fast 4×4 matrix multiply-accumulate; give major ML speedup
SFUs: handle sin/cos/exp/log; slower and fewer than FP32 cores
Load/Store units: handle memory read/write address calculation
Chapter 1.3: The Memory Hierarchy (Physical)
global memory: huge, high-latency, high-bandwidth storage; where all tensors initially sit; slowest level but largest
l2 cache: on-die, medium size, shared by all sms; faster than global; auto-caches data so repeated accesses don’t go back to hbm
shared memory: tiny, per-sm, extremely fast; manually controlled; used for blocking/tiling so threads can reuse data cheaply
registers: per-thread storage for immediate operands; fastest; extremely limited and heavily partitioned across threads
tensor cores only reach their 312-tfops peak when fed from shared memory because global memory (~1.5 tb/s) is too slow, so the fix is to fetch each tile once from global, stash it in shared memory (~19 tb/s), and reuse it repeatedly
Virtual Mapping
cuda gives you a virtual grid→block→thread model while the hardware dynamically maps the many launched blocks onto whatever sms are free, so the same kernel runs unchanged on gpus with 80, 108, or 132 sms
more sms just means more blocks execute simultaneously, increasing throughput with zero code changes
a gpu kernel is a function definition, but execution spawns a massive number of parallel instances
thread: smallest execution unit; runs kernel code independently; owns its registers and instruction pointer; roughly maps to an alu
block: group of threads that can share data via shared memory and synchronize (wait for each other to complete); limited in size (how many threads a block can have) because an sm has limited shared memory and registers; scheduler assigns one block at a time to an sm. (this means at a time only one block can run on a sm, but more than one block can be assigned)
grid: all blocks of a kernel launch; blocks are fully independent and never communicate; scheduler spreads them over all sms to utilize the whole gpu
look first we will look at some facts
when you write a cuda kernel, you define how many blocks your grid will have.
and you define how many threads each block will have. (these two are totally in your hands)
but how do you properly choose these two hyper params? we will go into it later in this blog post
fact #1 —> there are limits on threads per block (commonly 1024) and threads per sm (commonly 2048–4096), because each sm has finite registers, shared memory, and scheduling slots; exceeding these resources prevents additional threads from being issued
now lets see how many blocks can be alloted to a particular sm and how do we calculate that
sm has hard caps: 2048 threads, 192 kb shared memory, 65536 registers
each block consumes some portion of each resource; the number of blocks that fit is limited by whichever resource runs out first
scenario a (thread-limited): 256-thread block, no shared memory → 2048/256 = 8 blocks can fit; high occupancy. so when one block is waiting for memory the sm can run another block
scenario b (shared-memory-limited, 192kb only available): 256-thread block, 64 kb shared memory → 192/64 = 3 blocks fit; thread capacity unused because shared memory is the bottleneck
scenario c (register-limited, 65280 registers): 256 threads × 255 registers = 65280 registers → only one block fits; low occupancy and poor latency hiding
Cordinate System
You launch a grid of 100 blocks, each with 256 threads. Total threads: 100×256=25,600. All threads run the same kernel code, so each thread must compute a unique global index to know which element (pixel, array entry, etc.) it should process.
CUDA provides built-in variables inside a kernel (__global__ void MyKernel(...)):
threadIdx.x: Thread index within the block, 0…blockDim.x−10…blockDim.x−1.blockIdx.x: Block index within the grid, 0…gridDim.x−10…gridDim.x−1.blockDim.x: Number of threads per block (constant for that launch).
Global index
Standard 1D mapping:
int idx = blockIdx.x * blockDim.x + threadIdx.x;
Examples with blockDim.x = 256:
Block 0, Thread 0:
idx = 0 * 256 + 0 = 0Block 0, Thread 255:
idx = 0 * 256 + 255 = 255Block 1, Thread 0:
idx = 1 * 256 + 0 = 256Block 1, Thread 5:
idx = 1 * 256 + 5 = 261
Each thread computes this once and then operates on data[idx].
Handling non-multiple sizes
For N=1000 elements and blockDim.x = 256, you need 4 blocks:
4×256=1024 threads.
Valid indices:
0to999.Extra threads:
1000to1023(must do nothing).
Standard pattern:
__global__ void MyKernel(float* data, int N) {
    int idx = blockIdx.x * blockDim.x + threadIdx.x;
    if (idx < N) {
        data[idx] *= 2.0f;
    }
}
Threads with idx >= N exit immediately, so the kernel is safe for any NN.
suppose we have defined blocks = 100, and we have a gpu with only 10 sm and each sm can only take 2 blocks. so how will our code run? our code will first run 20 blocks on those sm’s and add the remaining 80 to the queue. then again run 20 from those 80 and so on.
The Memory Bottleneck
In normal computer science, we talk a lot about Big O notation: O(N), O(N2), and so on.
Big O tells us how the number of operations grows as the input size grows.
On GPUs, this is not enough.
For GPU speed, the main limit is often not how many math operations you do.
The main limit is how many bytes you move to and from memory.
So instead of only counting operations, you must also count bytes moved.
3.1 Arithmetic Intensity
The key metric for GPU performance is called Arithmetic Intensity.
This number tells you:
For each byte read or written from global memory, how many floating point operations do you do?
Higher intensity means you do more math per byte of data moved.
Lower intensity means you move a lot of data but do very little math with it.
Example 1: Element-wise Addition
Take a simple vector addition:
C[i]=A[i]+B[i]C[i]=A[i]+B[i]
For each element ii:
Math:
1 addition ⇒⇒ 1 FLOP.
Memory:
Read A[i: 4 bytes (assuming 32-bit float).
Read B[i]: 4 bytes.
Write C[i]: 4 bytes.
Total data per element:
4+4+4=12 bytes.
So the arithmetic intensity is:
Intensity=1 FLOP/12 Bytes≈0.083 FLOPs per byte
This is a very low number.
You do very little math for each byte you move.
Example 2: Matrix Multiplication (N×N)(N×N)
Now look at matrix multiplication of two N×NN×N matrices.
Math:
Roughly 2N^3 FLOPs.
Memory:
Read matrix A: N^2 elements.
Read matrix B: N^2 elements.
Write matrix C: N^2 elements.
Total elements: 3N^2.
If each element is 4 bytes: 3N^2×4 bytes.
Arithmetic intensity:
So intensity grows linearly with N.
This is a very high intensity.
You do a lot of math for each byte you move.
Why this matters on a real GPU (A100)
Take an NVIDIA A100 GPU:
Compute speed: about 312,000 GFLOPs (tensor operations).
Memory bandwidth: about 1,555 GB/s.
The hardware ratio is:
312,000/1,555 ≈ 200
This means:
To fully use the compute units, your kernel should do about 200 FLOPs for every 1 byte of global memory traffic.
This is the golden rule for this GPU.
Now compare our two examples:
Vector Add (intensity ≈0.083):
Much lower than 200.
The kernel will wait on memory most of the time.
The compute units will sit idle.
This kernel is memory bound.
Matrix Multiply with N=2048 (intensity ≈341):
Higher than 200.
Memory bandwidth is enough to feed the compute units.
The compute units can run at or near full speed.
This kernel is compute bound.
So, when you design GPU kernels for deep learning, you must ask:
How many FLOPs does this kernel do?
How many bytes from global memory does it read and write?
What is the arithmetic intensity, and how does it compare to the GPU’s hardware ratio?
If your intensity is too low, the GPU will be limited by memory bandwidth, not compute.
If your intensity is high enough, you can use the full compute power of the GPU.
note B (bytes/second) is fixed
there is a very interesting graph which we can analyze here
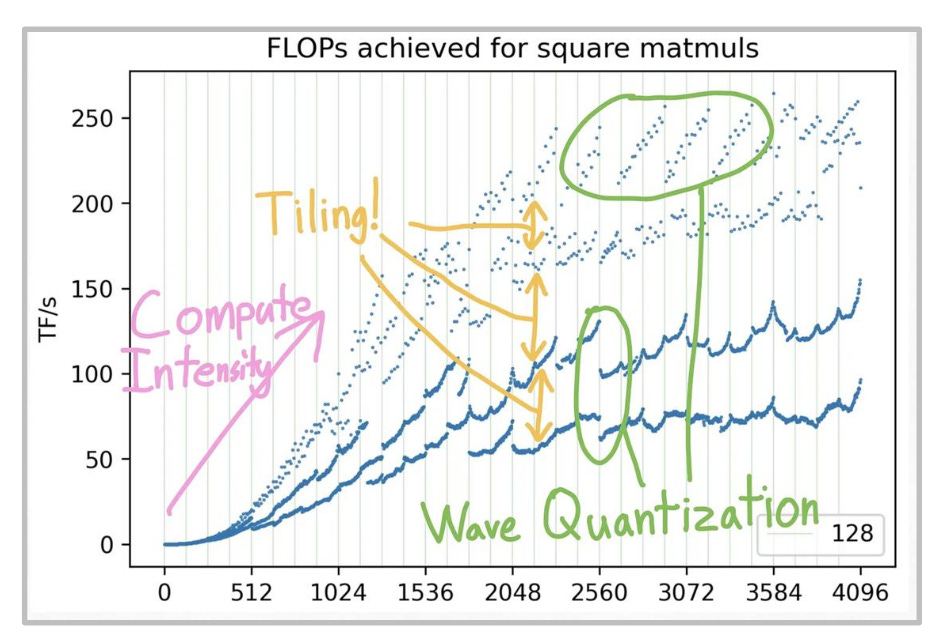
on x-axis here is the matrice size, now remember that Intensity for matrice multiplication are proportional to size of matrice right
so first you see a linear line like curve and later it flatens out because the peak performance of gpu hits.
there is a lot more to this curve which we will be covering in further concepts so lets move on !
Machine learning is full of matrix multiplication.
This is not because neural networks “prefer” matrices in some deep way.
The real reason is simple:
Matrix multiplication is one of the few operations that can beat the memory bottleneck on GPUs.
Element-wise operation (ReLU, addition, etc.)
Task: Take a vector of length N.
For each element: read it, change it, write it back.
Math operations:
You touch each element once.
Total math ≈N.
Memory accesses:
Read each element: N.
Write each element: N.
Total ≈2N
Intensity:
Intensity=0.5
Scaling:
If you make the vector 1000 times bigger, the intensity remains constant
So the intensity stays constant as N grows.
You never reach a point where you do “a lot” of math per memory access.
Global Memory Optimization
In C++ code, memory access looks simple:
float x = data[i];
It feels like the GPU goes to memory, reads that one float (4 bytes), and comes back.
This is not what really happens.
Global memory (DRAM) is not designed to read single bytes or single floats efficiently.
It is designed to read data in fixed-size chunks.
The physical wires between the GPU and the memory chips are called the memory bus.
Data moves over this bus in fixed-size units called transactions (also known as cache lines).
On modern NVIDIA GPUs:
Minimum transaction size is usually 32 bytes.
For high-throughput loads, the effective unit is often 128 bytes.
So if your code needs 4 bytes, the hardware does this:
The memory controller reads a 32-byte (or 128-byte) block from DRAM.
It sends that block over the memory bus.
You only use 4 bytes from that block.
The rest of the bytes are unused for that instruction.
You still pay:
The latency cost for the full transaction size.
The bandwidth cost for the full transaction size.
If you only needed 4 bytes from a 32-byte transaction, you used:
4/32=12.5% of the data
This is low efficiency.
GPUs are designed around warps: groups of 32 threads that run together.
The memory controller expects that threads in the same warp will access nearby addresses.
If thread 0 reads address X, the hardware expects thread 1 to read X+4, thread 2 to read +8, and so on.
If this happens, the hardware can bundle these requests into a small number of large transactions.
Warp memory requests
When a warp runs a load instruction (for example, a global load), the hardware does the following:
It looks at the memory addresses requested by all 32 active threads in the warp.
It finds how many 128-byte transactions are needed to cover all these addresses.
It issues that many transactions to DRAM.
The number of transactions depends on how the threads access memory.
Scenario A: Sequential (coalesced) access – ideal
Thread 0 requests address 0
Thread 1 requests address 4
Thread 2 requests address 8
...
Thread 31 requests address 124
Here:
The addresses go from byte 0 to byte 127.
This is exactly 128 bytes of contiguous memory.
The memory controller sees that all 32 requests fall inside one 128-byte block.
It issues a single 128-byte transaction.
All 32 loads are served by this one transaction.
Result:
The bus moves 128 useful bytes.
All 128 bytes are used by the program.
Efficiency: 100%.
This is the best case.
Scenario B: Strided or scattered access – worst case
Thread 0 requests address 0
Thread 1 requests address 1000
Thread 2 requests address 2000
...
Now the addresses are far apart.
They do not fit into one 128-byte block.
They are in different regions of memory.
The memory controller cannot group these into one transaction.
So it must:
Issue 1 transaction for thread 0’s address.
Issue 1 transaction for thread 1’s address.
...
Issue 1 transaction for each of the 32 threads.
Total:
32 separate transactions.
Each transaction transfers at least 32 bytes.
So:
Total data moved on the bus: 32×32=1024 bytes.
Useful data actually used by your code: 32×4=128 bytes.
Efficiency:
Efficiency=128/1024=12.5%
That means you get only a small fraction of the possible bandwidth.
The rest is wasted on unused bytes.
Example :- reading elements from a matrice
matrix is 32×32 stored in row-major, memory is linear row by row
row 0 has 32 floats, then row 1 has 32 floats, and so on
case 1: reading a row with 32 threads
each thread reads one element from the same row
addresses increase by 4 bytes each time
all 32 addresses fall inside one continuous 128-byte range
hardware combines them into one memory transaction
result: highest possible memory efficiency
case 2: reading a column with 32 threads
each thread reads one element from the same column
element in next row is 128 bytes ahead because each row is 32 floats
addresses are 0, 128, 256, … for each thread
addresses are far apart and not in one continuous segment
hardware cannot merge them
result: 32 separate memory transactions and much lower efficiency
but what happens if i read half elements from one row and other half from another, but the elements are continuous
gpu checks only the final memory addresses requested by the warp, not which row they belong to
if the 32 threads read addresses that form one continuous 128-byte range, it counts as coalesced
it does not matter whether those addresses are from one row or split across two rows
if the boundary between rows happens to align such that addresses are still continuous in memory, gpu still issues one transaction
Memory Alignment
We established that the GPU reads memory in 128-byte transactions. However, these transactions are not arbitrary windows. They are aligned to specific boundaries.
The Grid:
Memory is like a grid of 128-byte slots.
Slot 0: Addresses 0 to 127.
Slot 1: Addresses 128 to 255.
Slot 2: Addresses 256 to 383.
The GPU can fetch “Slot 0” or “Slot 1”. It generally cannot fetch “The 128 bytes starting at Address 4.”
The Problem: Misaligned Data
Imagine you have a perfectly coalesced access pattern (threads reading sequential addresses 0-127).
Case A (Aligned): The array starts at Address 0.
The request covers 0 to 127.
This falls exactly into Slot 0.
Cost: 1 Transaction.
Case B (Misaligned): The array starts at Address 4 (maybe you offset the pointer).
Thread 0 reads Address 4.
Thread 31 reads Address 131.
The Request: Bytes 4 to 131.
The Mismatch: This range crosses the boundary. It touches the end of Slot 0 (4-127) and the beginning of Slot 1 (128-131).
Hardware Action: The Memory Controller must fetch Slot 0 AND Slot 1.
Cost: 2 Transactions.
On-Chip Memory and Tiling
We established in Chapter 3 that Matrix Multiplication is Compute Bound (Intensity ~ N/6 ).
However, that math assumes you only read each number from Global Memory once.
If you write a naive kernel where every thread reads its own data from Global Memory over and over again, you are Memory Bound.
let us prove this mathematically
We are multiplying two N×N matrices.
We want to calculate one single element of the output matrix: C[row][col].
The formula:
C[row][col] = sum from k = 0 to N-1 of (A[row][k] * B[k][col])
So we must calculate the dot product of row i of A and column j of B.
Scenario 1: The Naive Kernel (No Shared Memory)
In this kernel, every thread is responsible for calculating one element of C.
The kernel logic (pseudo):
Thread calculates C[y][x]
Initialize sum = 0.0
For k from 0 to N-1:
Read A[y][k] from global memory
Read B[k][x] from global memory
Compute sum += A[y][k] * B[k][x]
Write C[y][x] = sum
Math analysis (for the whole grid):
Total threads:
N×N threads (one per output element).
Operations per thread:
The loop runs N times.
Each iteration does 1 multiply + 1 add = 2 FLOPs.
Total FLOPs:
Per thread: 2N
All threads: (N×N threads) × (2N FLOPs per thread) = 2N^3 FLOPs.
This matches the theoretical complexity of matrix multiplication.
Memory accesses per thread:
The loop runs N times.
In each iteration, we read A (4 bytes) and B (4 bytes) from global memory.
Reads per thread:
2N reads.
Total global reads (all threads):
(N×N threads) × (2N reads) = 2N^3 reads.
Bytes transferred:
Each read is 4 bytes.
Total bytes = 2N^3 × 4 bytes = 8N^3 bytes.
Arithmetic intensity:
Intensity = (total FLOPs) / (total bytes)
= (2N^3 FLOPs) / (8N^3 bytes)
= 0.25 FLOPs per byte.
Verdict:
Arithmetic intensity is 0.25 ops/byte.
This is very low.
An NVIDIA A100 GPU needs about 200 ops/byte to reach peak compute performance.
So this naive kernel will run at around 0.1% of the GPU’s peak performance.
so this does not scale with size and we are in a big problem
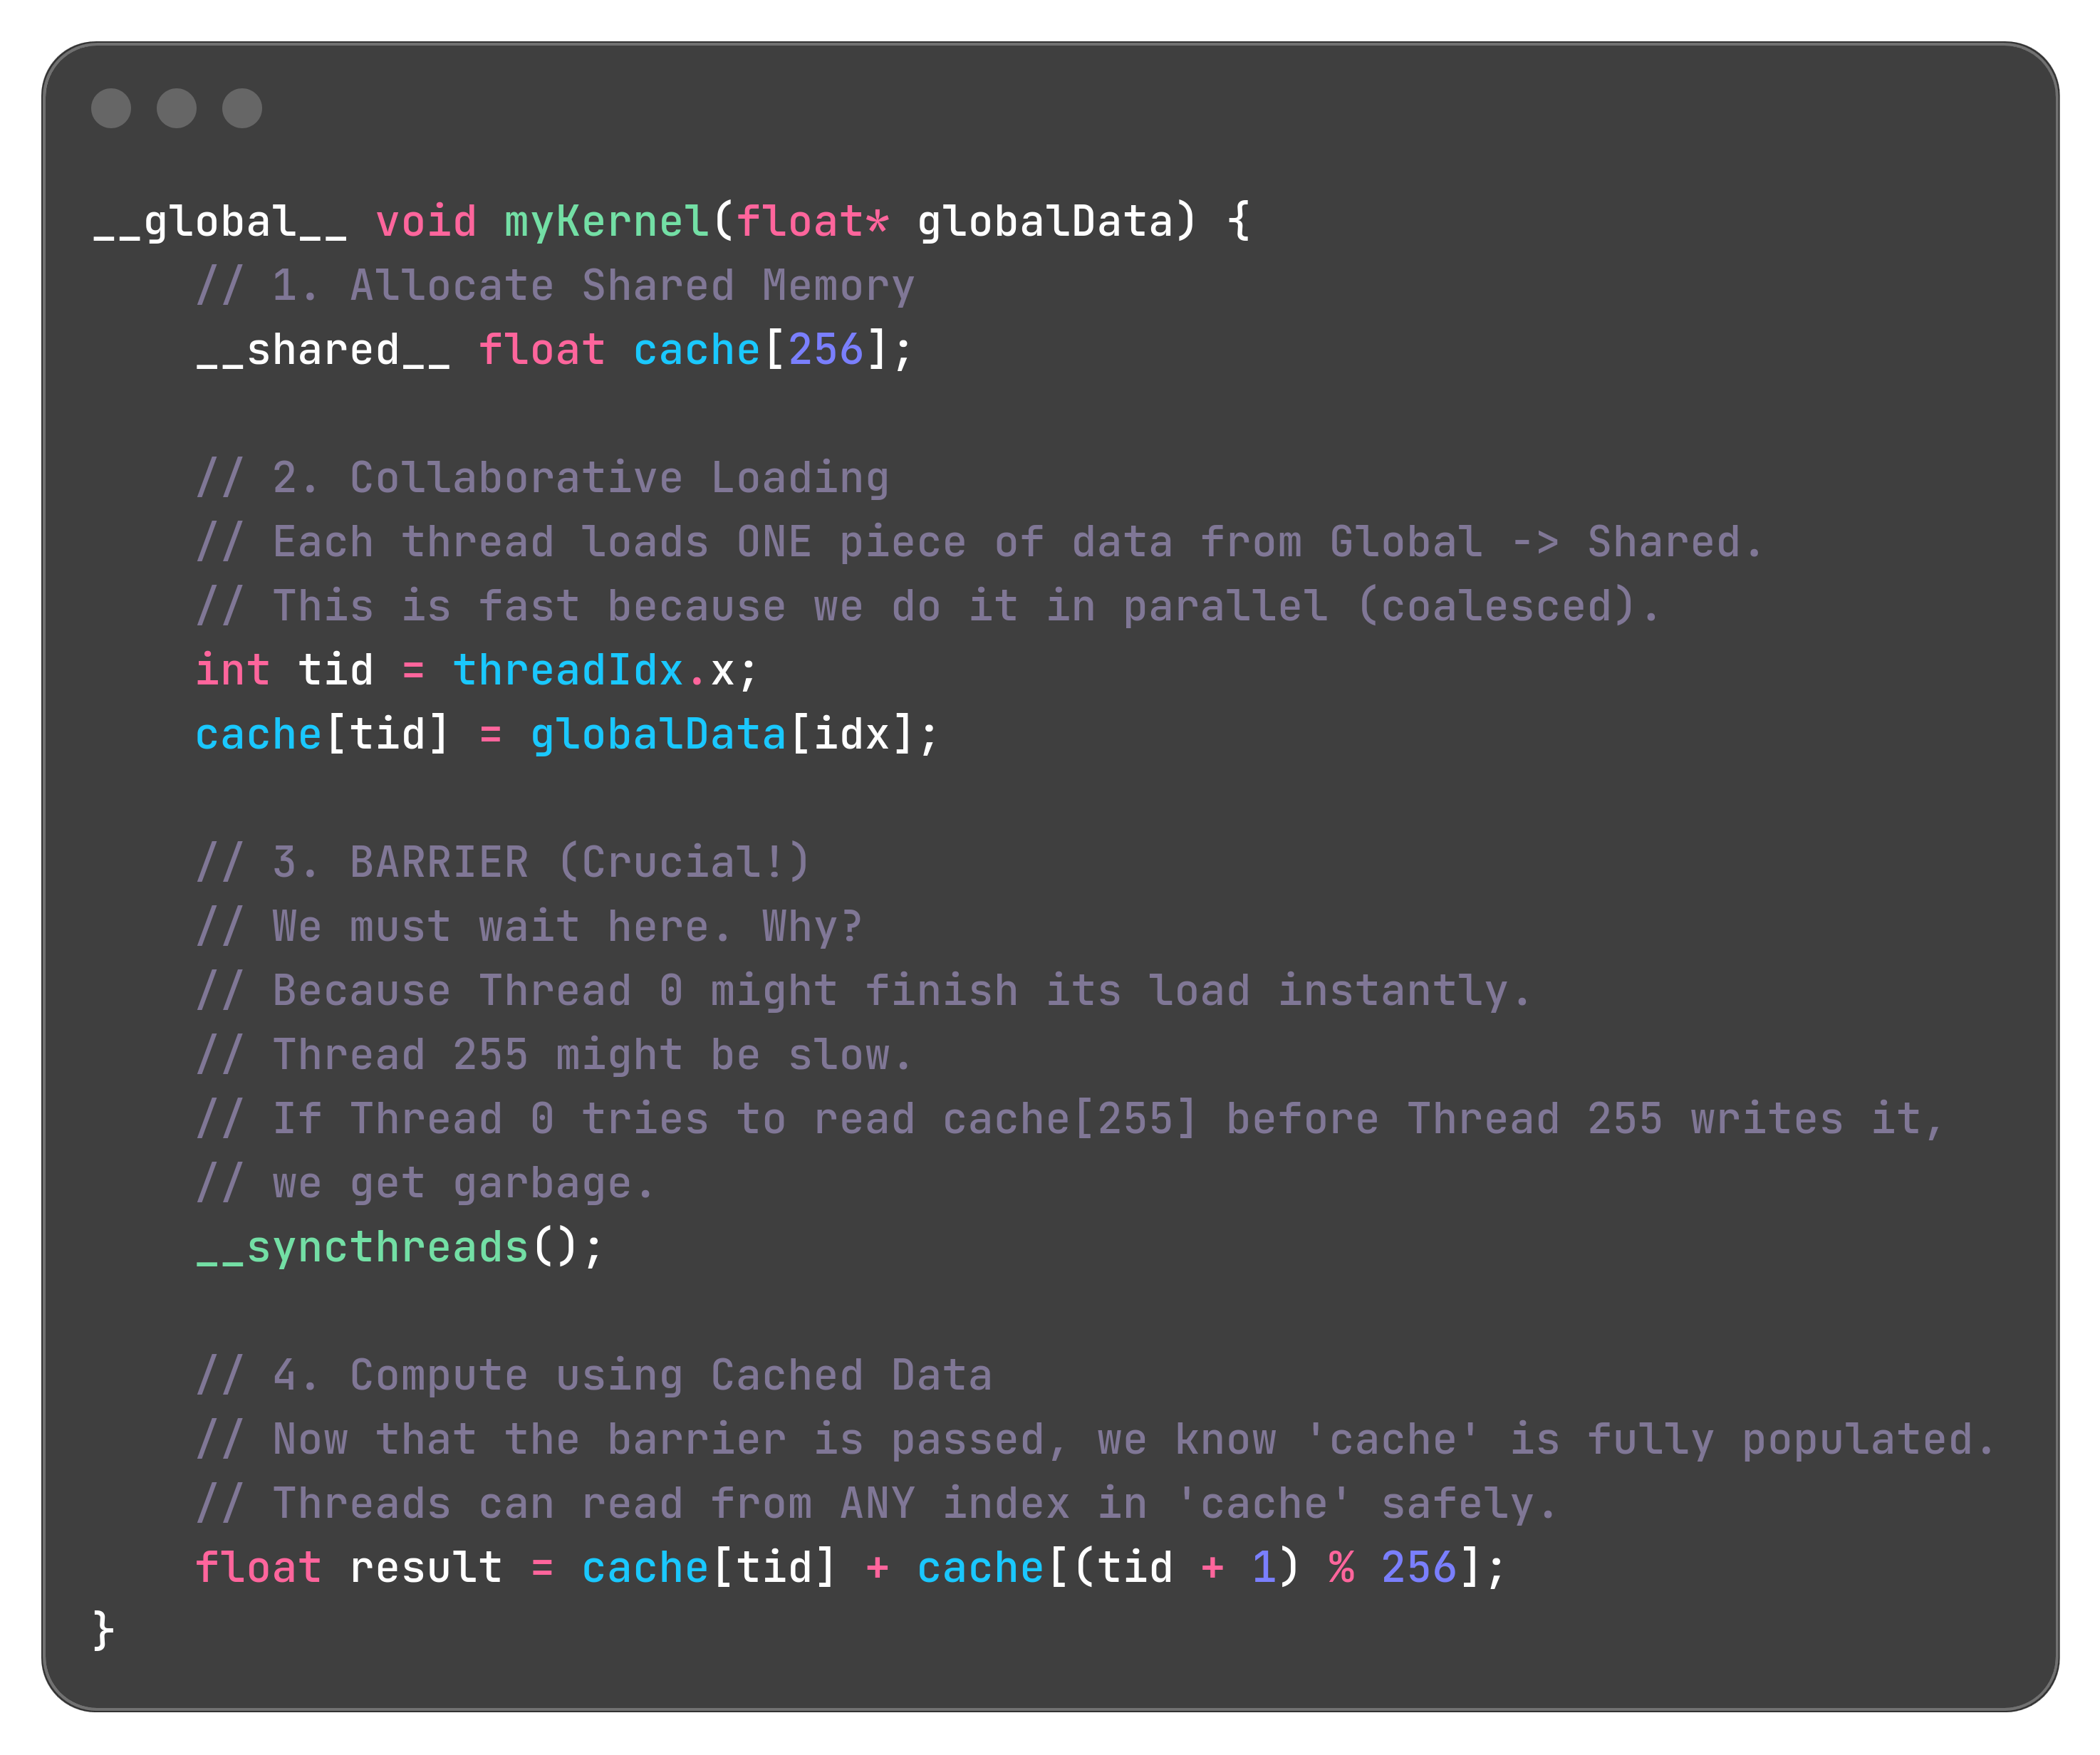
Shared memory comes to save us.
It is Programmable. Unlike a CPU’s L1/L2 cache, which handles itself automatically, Shared Memory does nothing unless you write code to load data into it.
Variable Scope
When you declare a variable in CUDA, the keyword determines where it lives:
float x; (Local Variable)
Memory: Register.
Scope: Private to one thread. Thread A cannot see Thread B’s x.
__shared__ float tile[256]; (Shared Variable)
Memory: Shared Memory (SRAM).
Scope: Visible to all threads in the same Block.
Lifetime: Exists as long as the Block is running. Once the Block finishes, this memory is wiped.
Isolation: Block 0 cannot see Block 1’s shared memory.
The Danger: Race Conditions
Since all 256 threads in a block see the same tile array, they can crash into each other.
Thread 0 tries to write to tile[0].
Thread 1 tries to read from tile[0] at the same time.
Result: Undefined behavior. Garbage data.
The Solution: __syncthreads()
This is the most important function in Shared Memory programming.
Action: It creates a barrier.
Rule: “No thread in the block is allowed to proceed past this line of code until ALL threads in the block have reached this line.”
The General Pattern
Tiling
The goal
We want to calculate C = A × B.
The output matrix C has size N×N.
We divide C into small square blocks of size TILE_SIZE × TILE_SIZE.
We choose TILE_SIZE = 32.
We focus on one block of C, call it Block_C.
This block covers rows 0…31 and columns 0…31 of the output.
One CUDA thread block (with 32×32 = 1024 threads) is assigned to this Block_C.
The goal of this thread block is to compute all 32×32 elements of Block_C.
Step 2: The data dependency
To calculate Block_C (rows 0–31, cols 0–31), we need the following data:
From matrix A:
We need rows 0 to 31.
For each of these rows, we need all columns from 0 to N−1.
So we need a strip of size 32×N from A.
From matrix B:
We need columns 0 to 31.
For each of these columns, we need all rows from 0 to N−1.
So we need a strip of size N×32 from B.
Visualization example
Assume A and B are 2048×2048.
To compute our small 32×32 output block, we need:
From A: a horizontal strip of size 32×2048.
From B: a vertical strip of size 2048×32.
Shared memory limitation
We cannot fit these large strips into shared memory.
For A’s strip: 32×2048 floats = 65536 floats.
Each float is 4 bytes, so size = 65536 × 4 bytes = 262144 bytes ≈ 256 KB.
Typical shared memory per SM is about 48 KB on many GPUs (up to about 100 KB on A100).
Therefore, a full 32×2048 strip does not fit into shared memory.
insight
lets break the matrix multiply even more
this above can be written like this below.
taking the assumption that N is a multiple of 32, we will relax it soon
Our goal: a thread block must compute a 32×32 tile of C.
Inside this tile, the local row index i goes from 0 to 31 and the local column index j goes from 0 to 31.
We now trace a single thread: the one responsible for C within this tile.
For this thread, i = 0 and j = 0.
Its job is to calculate:
The outer loop (the phases ph)
The for loop in the tiled kernel iterates over the outer sum
Let us step through it.
Phase 0 (ph = 0)
In this phase, the thread needs to compute the first partial sum:
PartialSum0=
Simplified:
Data needed in phase 0
For this computation, thread (0,0) needs row 0 of A from columns 0 to 31 and column 0 of B from rows 0 to 31.
Thread (0,1) needs row 0 of A and column 1 of B.
Thread (1,0) needs row 1 of A and column 0 of B.
In fact, all threads in the thread block need access to the same 32×32 block of A (rows 0–31, cols 0–31) and the same 32×32 block of B (rows 0–31, cols 0–31).
Collaborative load for phase 0
Instead of each thread loading all the data it individually needs, the threads cooperate to load these tiles into shared memory:
Each thread loads one element from A and one element from B into shared memory.
Thread (0,0) loads A[0][0] into As[0][0] and B[0][0] into Bs[0][0].
Thread (5,10) loads A[5][10] into As[5][10] and B[5][10] into Bs[5][10].This continues similarly for all 1024 threads in the 32×32 block.
A barrier (such as __syncthreads()) is then used so that all threads wait until the entire tile has been loaded into shared memory.
Now the entire 32×32 tiles of A and B needed for this phase are cached in shared memory.
Computation of the inner sum in phase 0
Now thread (0,0) runs its inner summation ∑klocal=0 to 31 using As and Bs in shared memory, which is fast.
Using these tiles, it computes PartialSum_0 and adds it to its running result for C.
Phase 1 (ph = 1)
In the next phase, the thread must compute the second partial sum:
PartialSum1=
Simplified:
Data needed in phase 1
Now thread (0,0) needs A’s data from row 0, columns 32 to 63, and B’s data from column 0, rows 32 to 63.
Again, every thread in the thread block needs this new 32×32 chunk of A and B, but with the appropriate offset for its own row and column.
Collaborative load for phase 1
The threads repeat the collaborative loading process, but now with an offset in the global indices:
Thread (0,0) loads A[0][32] into As[0][0] and B[32][0] into Bs[0][0].
Thread (5,10) loads A[5][42] into As[5][10] and B[42][10] into Bs[5][10].All threads in the block similarly load one element of the current tile of A and one element of the current tile of B.
Another synchronization (__syncthreads()) ensures all data for this new phase is present in shared memory before computation proceeds.
Computation of the inner sum in phase 1
Thread (0,0) again runs its inner loop over klocal=0…31, this time using the newly loaded tiles in As and Bs.
It computes PartialSum_1 and adds it to its running total for C.
After all phases ph from 0 to (N/32)−1(N/32)−1 are processed in this way, the thread has accumulated the full value of C.
here is the code implementation
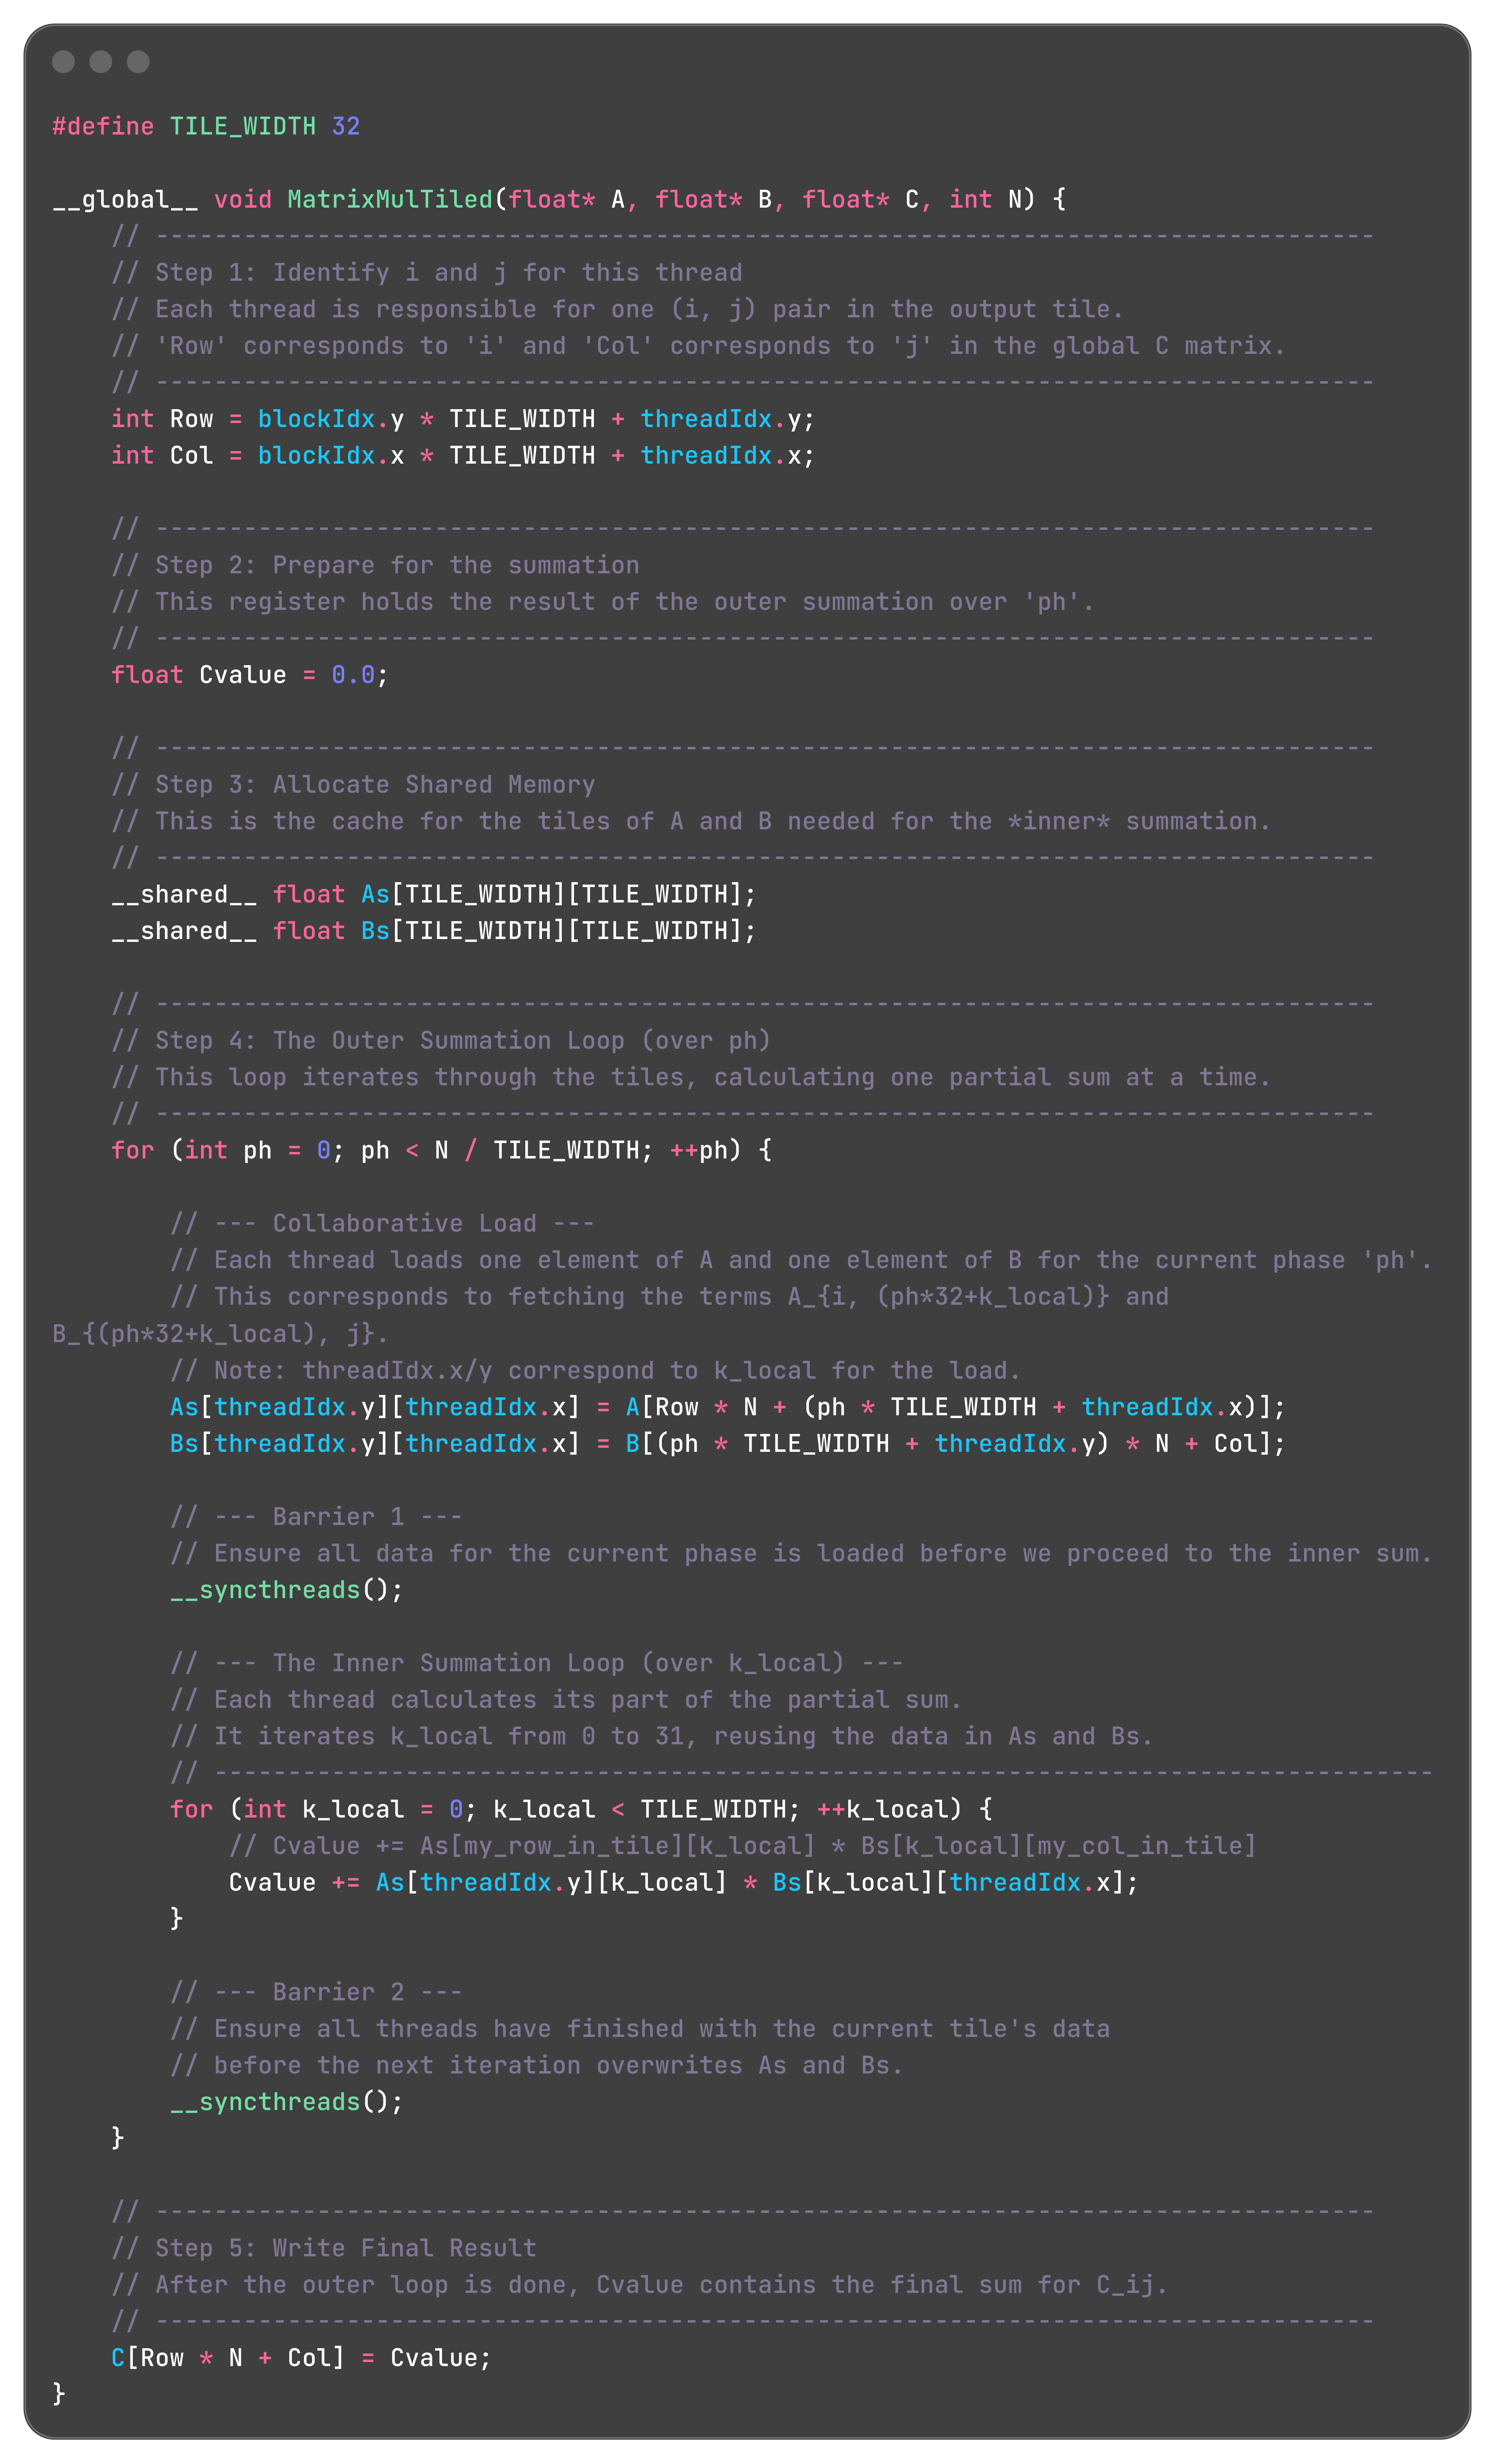
lets see the efficiency
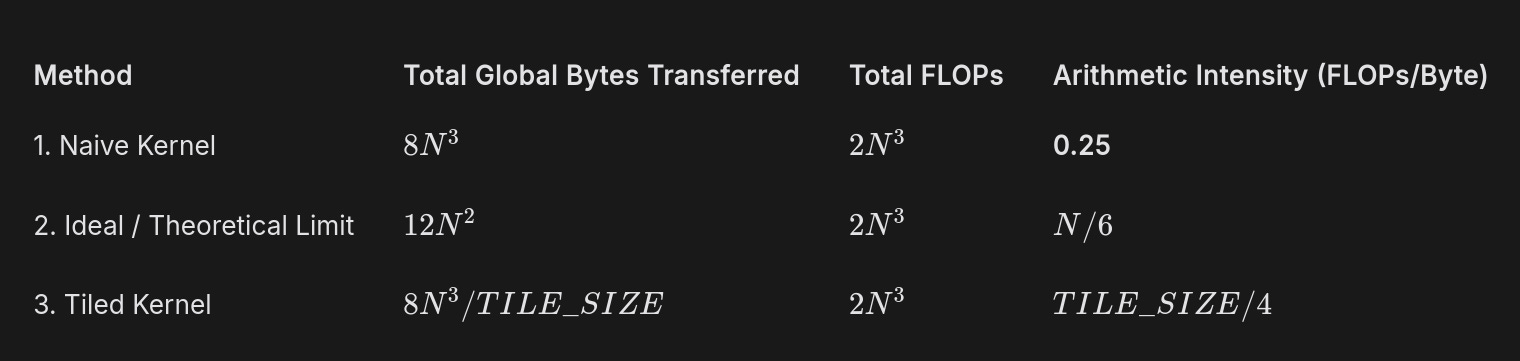
how did we derived these values for the last tiled kernel part? it’s your homework
also you might be thinking this does not scale with N so it is not efficient. there is another optimization which makes that possible but we are not going over that
Wraps
So far, we have been using a convenient simplification: we imagined that 1024 threads in a block all run independently and in parallel.
Now, we will look at how the SM actually executes these threads. This will explain many of the strange performance artifacts you see in real-world GPU code.
The hardware scheduler inside the SM does not see 1024 individual threads. It sees groups of 32.
A Warp is a group of 32 consecutively numbered threads that execute in lockstep.
In a block of 256 threads:
Threads with threadIdx.x from 0 to 31 form Warp 0.
Threads with threadIdx.x from 32 to 63 form Warp 1.
...and so on.
A block of 256 threads is composed of 8 Warps (256 / 32).
The number 32 is a hardware design choice by NVIDIA, and it is fundamental to the architecture.
The SM’s instruction scheduler fetches one instruction from memory (e.g., ADD R1, R2, R3).
It issues this single instruction to a Warp.
All 32 threads in that Warp execute that exact same instruction at the exact same time.
They operate on different data because each thread has its own private registers (R1 for Thread 0 is different from R1 for Thread 1), but the operation itself is identical for all of them.
now you must be thinking the code we wrote in the tiling part, had both + and multiplication in a single thread. actually some operations like AB + C, has been made a single operation by gpu cores.
Control Divergence
We’ve established the core rule of SIMT: All 32 threads in a Warp must execute the same instruction at the same time.
The Problem: What happens when the code has an if/else statement?
The Setup:
Let’s analyze a simple kernel with the parameters you suggested.
Block Size: 256 threads.
This means: 8 Warps (Warp 0 to Warp 7).
consider this cod
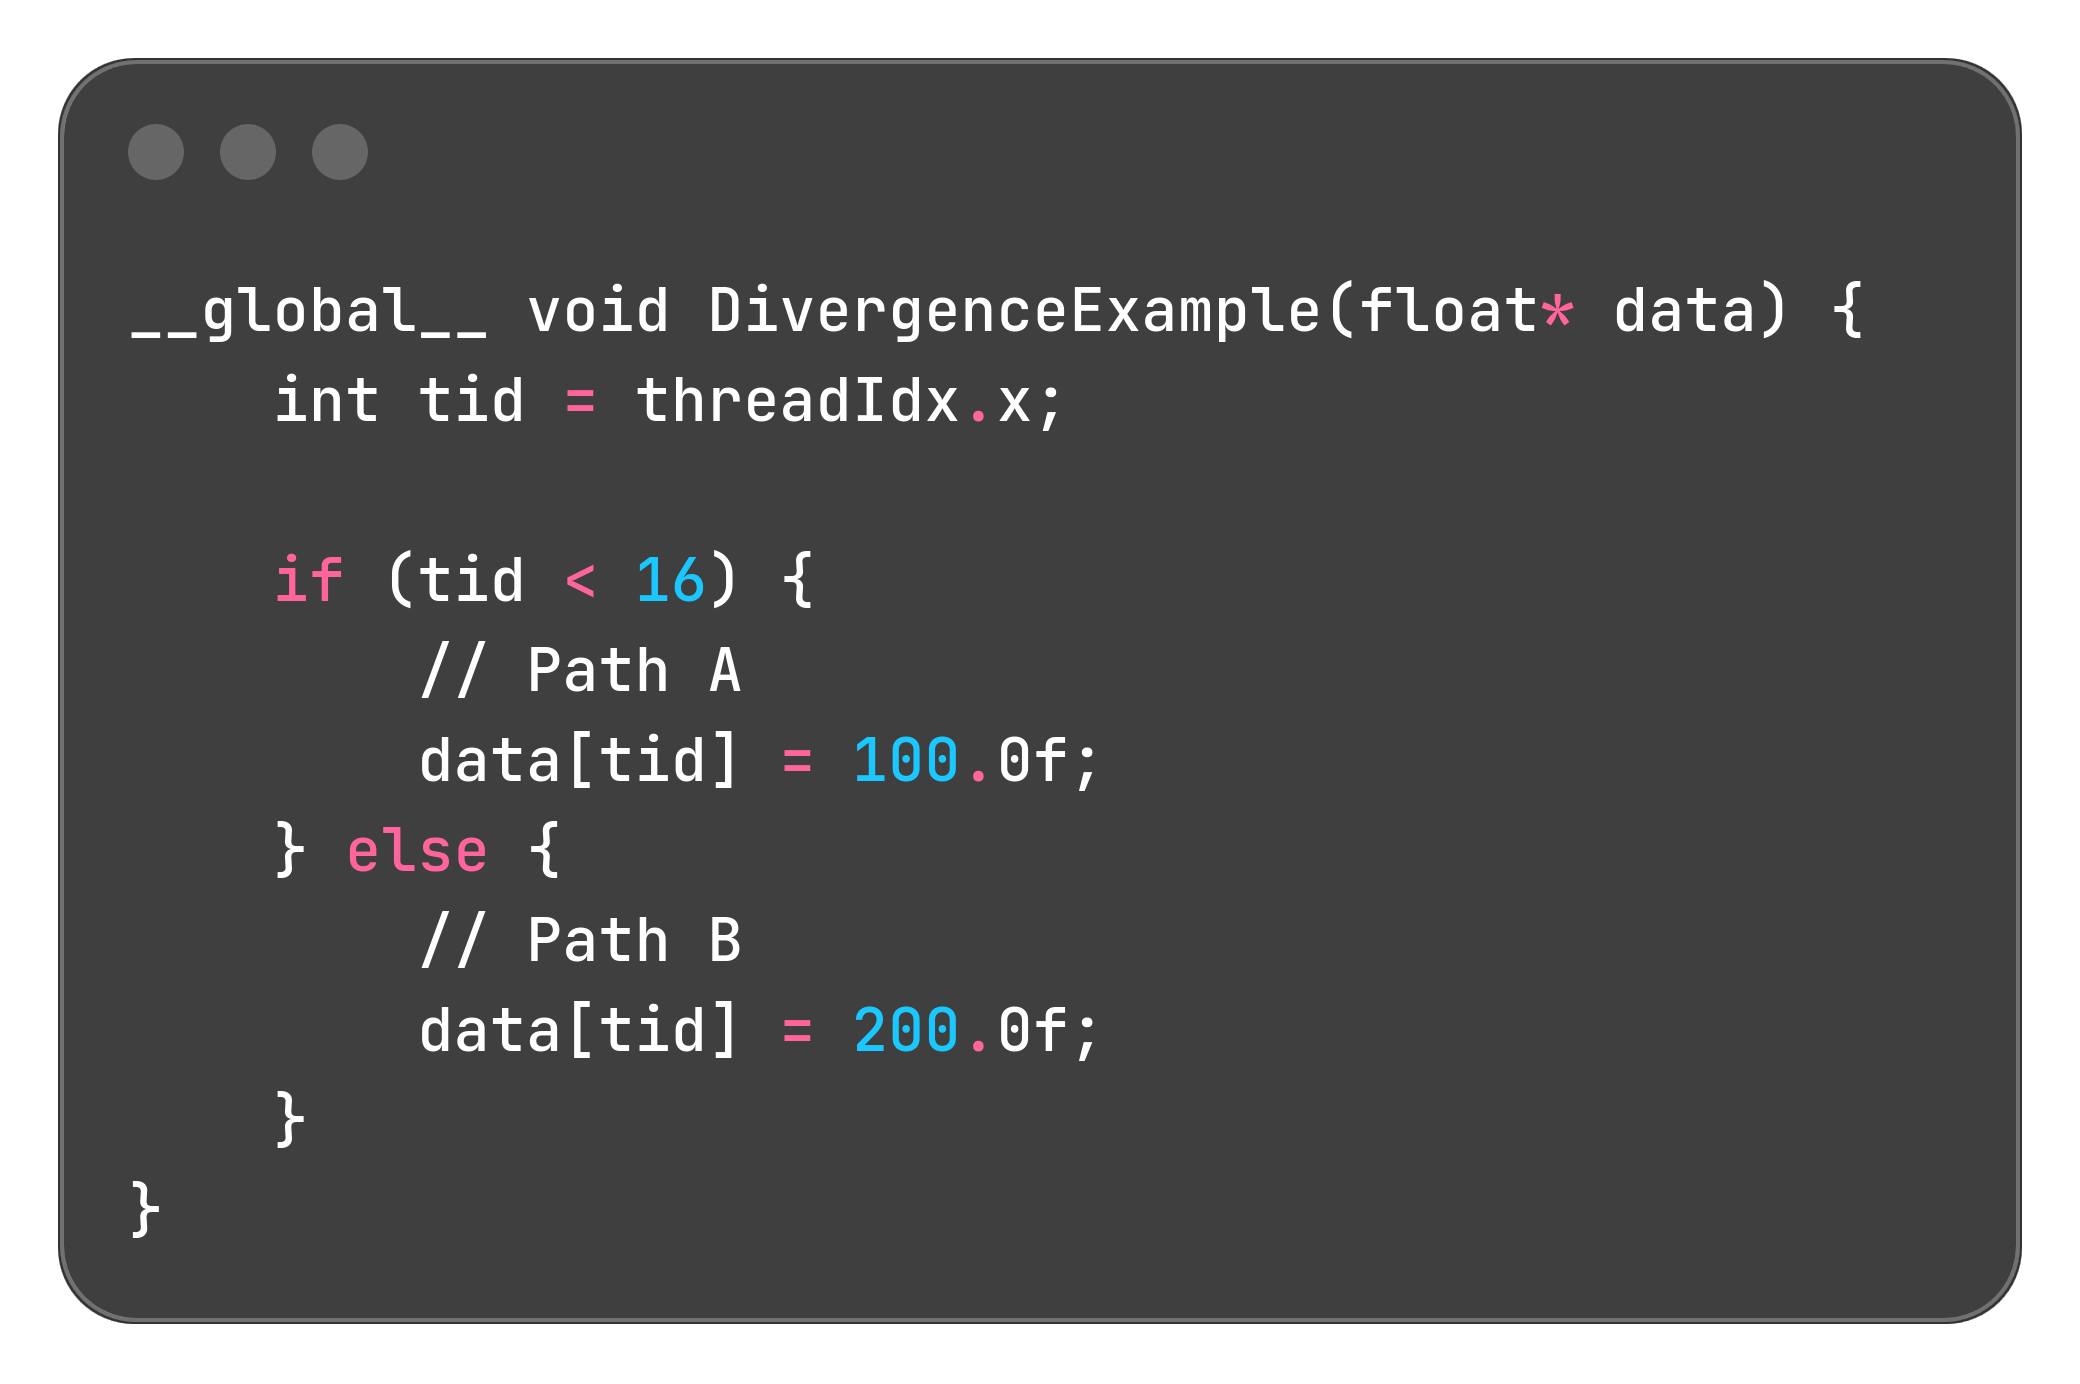
Let’s trace what the hardware does, Warp by Warp.
Trace 1: Warp 1 through Warp 7 (Threads 32 to 255)
Consider any thread in these Warps, for example, Thread 40.
Its tid is 40.
The condition 40 < 16 is false.
Every single thread in Warp 1, 2, 3, 4, 5, 6, and 7 evaluates the condition to false.
Result: They all agree. The hardware simply skips Path A and executes the instructions for Path B.
Performance: Perfect. No time is wasted. This is Uniform Control Flow.
Trace 2: Warp 0 (Threads 0 to 31)
This is where the problem occurs.
Threads 0 to 15:
Their tid is less than 16. The condition is true.
They want to take Path A.
Threads 16 to 31:
Their tid is 16 or greater. The condition is false.
They want to take Path B.
The Warp has a disagreement. The hardware cannot execute Path A and Path B at the same time. It must serialize them.
The Hardware’s Solution (Predicate Registers):
Evaluate: All 32 threads evaluate the condition tid < 16.
Masking: A “mask” is created for the Warp.
Threads 0-15 are marked as “active.”
Threads 16-31 are marked as “inactive.”
Execute Path A: The hardware executes the instruction data[tid] = 100.0f;.
Only the “active” threads (0-15) are allowed to actually write to memory.
The “inactive” threads (16-31) do nothing. They are stalled. They waste this clock cycle.
Invert Mask: The hardware flips the mask.
Threads 0-15 are now “inactive.”
Threads 16-31 are now “active.”
Execute Path B: The hardware executes the instruction data[tid] = 200.0f;.
Only the “active” threads (16-31) write to memory.
Threads 0-15 are now stalled.
The Cost:
A uniform Warp would have taken 1 cycle (executing either Path A or Path B).
Our diverged Warp took 2 cycles (executing Path A, then Path B).
Performance on Warp 0 was cut in half.
This phenomenon is called Control Divergence.
Divergence only happens when threads within the same Warp disagree on which path to take.
Divergence between different Warps is fine (Warp 0 can take Path A while Warp 1 takes Path B).
The performance penalty is proportional to the number of divergent paths. An if/else costs 2x. A switch statement with 4 paths could cost 4x.
Rule: To write fast code, try to structure your data and logic so that threads in a Warp agree on control flow. For example, if you are processing different types of particles, sort them by type first so that Warp 0 only processes “Type A” particles and Warp 1 only processes “Type B”.
Wave Quantization
The Setup
Let’s use a concrete example.
GPU: An NVIDIA A100 with 108 SMs.
Kernel: A Tiled Matrix Multiplication.
Workload: We are calculating a large output matrix. This work is divided into many independent Thread Blocks.
Key Fact: Each Thread Block is a single “unit of work” that must be scheduled to an SM.
The GPU can process work in waves. In a perfect world, it processes 108 Blocks in the first wave, then the next 108 Blocks, and so on.
The “Good” Case: Perfect Divisibility
Imagine our matrix dimensions are such that we need to launch exactly 216 Thread Blocks.
Wave 1: The GPU scheduler assigns Blocks 0-107 to the 108 SMs. All SMs are 100% busy.
Wave 2: As soon as the first wave finishes, the scheduler assigns Blocks 108-215 to the 108 SMs. All SMs are 100% busy again.
Result: The GPU is fully occupied for the entire duration. Performance is at its peak for that algorithm.
The “Bad” Case: The Tail Effect
Now, let’s say we change the matrix dimension by just one pixel.
This tiny change causes the number of required Thread Blocks to become 217.
Wave 1: The scheduler assigns Blocks 0-107. All 108 SMs are busy.
Wave 2: The scheduler assigns Blocks 108-215. All 108 SMs are busy.
Wave 3 (The “Tail Wave”):
The scheduler has only one Block left to run (Block #216).
It assigns this block to SM 0.
What are the other 107 SMs doing? Nothing. They are completely idle.
The entire GPU, a multi-thousand-dollar accelerator, is sitting and waiting for one SM to finish this single, final block of work.
The Performance Impact:
The total time taken is the time for Wave 1 + Wave 2 + Wave 3.
Even though Wave 3 has almost no work, it still takes the same amount of time as a full wave.
Time for 216 Blocks: ~2 units.
Time for 217 Blocks: ~3 units.
We added 1/216 (~0.5%) more work, but the runtime increased by 1/2 (50%).
This causes a massive, sudden drop in achieved TFLOP/s.
Reductions
A reduction turns many input elements into one output value using an associative binary operator like +, max, or min. For summation, this means combining all elements of an array into a single scalar.
Sequential vs parallel
A naive sum on the CPU uses a single loop:
Initialize sum = 0.
For i from 0 to N−1, do sum = sum + data[i].
Each iteration depends on the previous one because the new sum uses the old sum. This makes the loop inherently sequential, so a single GPU thread doing this loop would not exploit parallelism.
Tree reduction idea
Addition is associative, so the grouping of terms does not change the result:
Sequential: (((a0 + a1) + a2) + a3) + ...
Tree: (a0 + a1) and (a2 + a3) can be computed in parallel, then their partial sums added, and so on.
With 8 elements and 4 threads:
Step 1 (stride = 4): 4 threads each add pairs 4 apart, producing 4 partial sums in the first half of the array.
Step 2 (stride = 2): 2 threads add those partial sums, producing 2 values.
Step 3 (stride = 1): 1 thread adds the last two values, leaving the final result in element 0.
The number of active threads halves every step, giving a tree of depth log2(N)log2(N) instead of doing all N additions in a chain.
CUDA shared-memory implementation
Within a block, the algorithm is:
Load: All threads cooperatively copy one element each from global memory into a shared-memory array sdata.
Sync: Call __syncthreads() so every thread sees all loaded values.
Iterative Reduction: We loop, cutting the number of active threads in half each time.
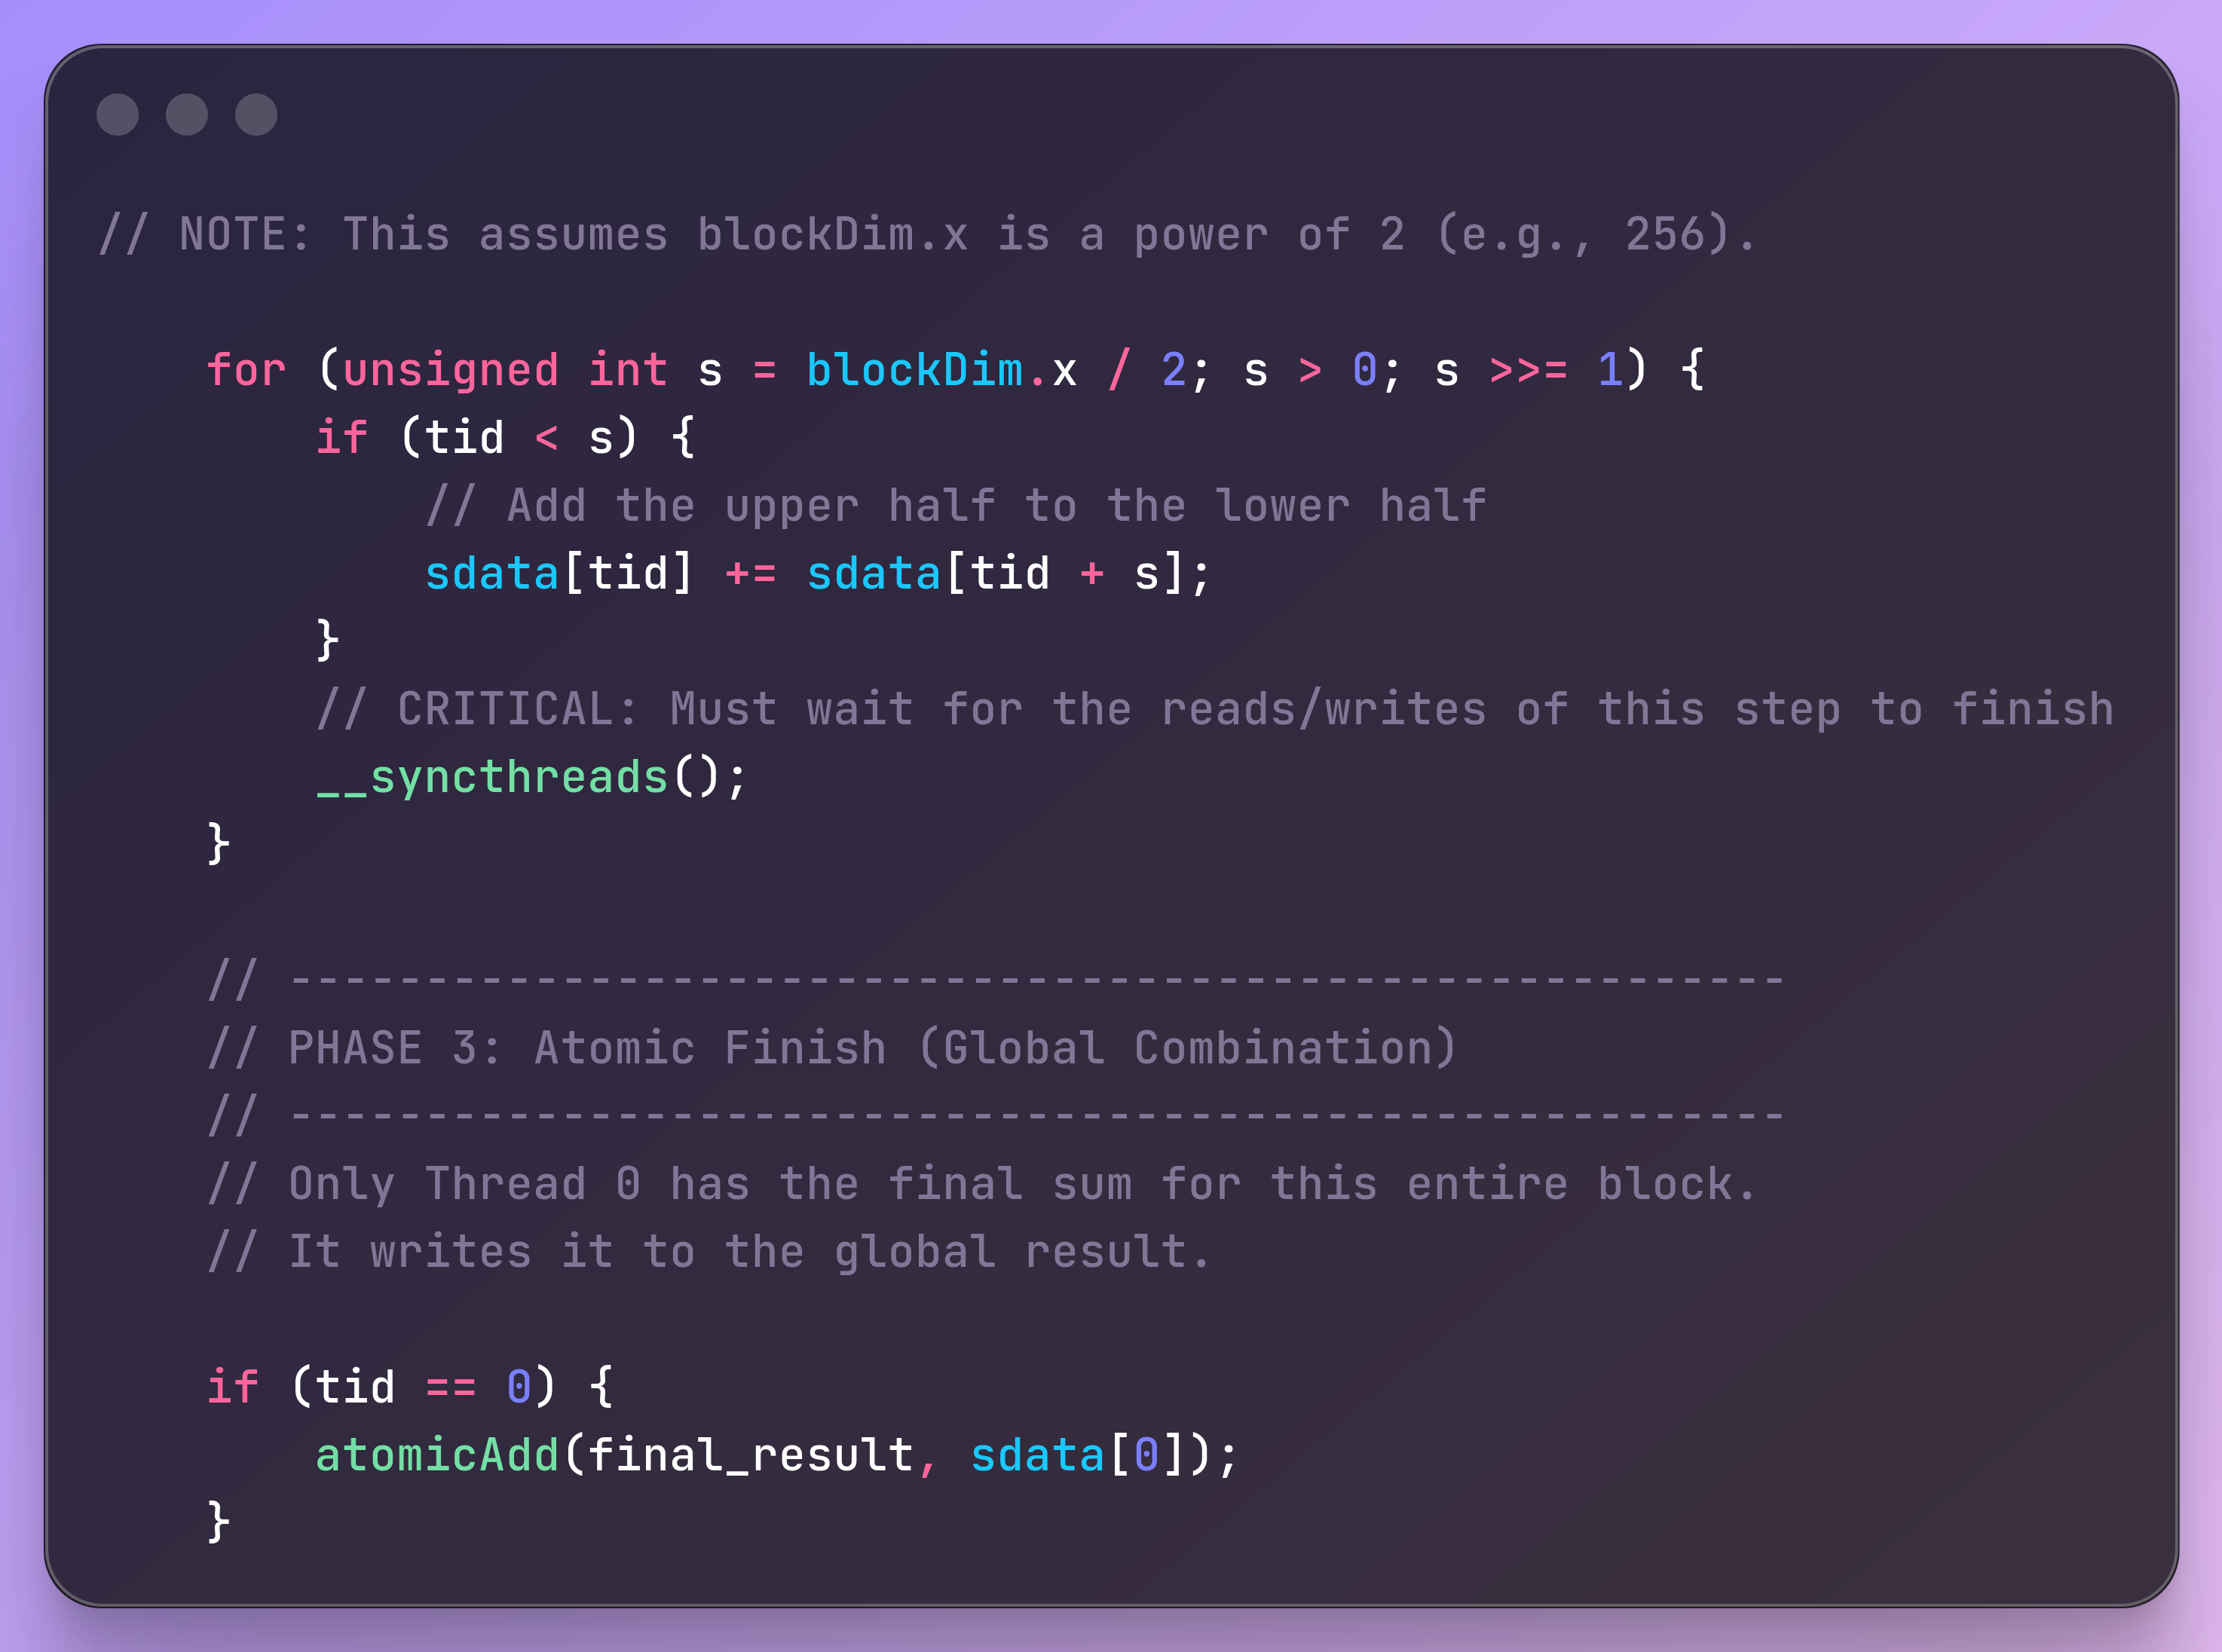
Final Write: After the loop, sdata[0] holds the sum for the entire block. Thread 0 is responsible for writing this partial sum back to a global results array.
what if the number of elements we want to add are greater than the number of threads available to us?
suppose we want to sum 200 million numbers
Instead of each thread processing one element, each thread processes many elements.
Launch a Fixed Grid: We launch enough blocks to saturate the GPU (e.g., 1000 blocks of 256 threads = 256,000 threads total).
Looping: These 256,000 threads act like a swarm of “pac-men.” They eat the first 256,000 numbers. Then they all jump forward by the grid size and eat the next 256,000 numbers. They repeat this until the 200 million numbers are consumed.
Local Accumulation: While looping, each thread maintains a private running total in a register.
lets calculate intensity for this operation
Reads: We read N floats to populate sdata.
Bytes Read = 4 * N.
Writes: We write one single float (the final sum) back.
Bytes Written = 4.
Total Global Bytes: 4N + 4. For large N, this is approximately 4N
The reduction performs N-1 additions to sum N numbers.
For example, to sum 8 numbers, you do 4 adds, then 2 adds, then 1 add. Total = 7 adds.
Total FLOPs: N - 1. For large N, this is approximately N.
I = N/4N = 1/4
Atomic Operations
If you try to do parallel reduction by having all threads add to a single shared counter (like global_sum), you can run into a race condition. Here’s what happens:
You have a memory location (global_sum), initialized to 0.
Thread A reads its value (for example, data is 5).
Thread B reads its value (for example, data is 10).
Both threads try to add their own value to global_sum at the same time.
The problem:
Thread A reads global_sum (0).
Thread B reads global_sum (0).
Thread A calculates 0 + 5 = 5.
Thread B calculates 0 + 10 = 10.
Thread A writes 5 to global_sum.
Thread B writes 10 to global_sum.
Final result: global_sum is 10 (not 15). Thread A’s addition was overwritten.
Why did this happen?
Both threads read the same starting value before either finished updating global_sum.
They “race” each other—whichever thread writes last “wins,” and the other’s update is lost.
The Solution: Atomic Operations
Hardware provides “atomic” instructions, which guarantee the entire sequence (read, modify, write) is performed without interruption.
In CUDA, the function is atomicAdd(&address, value).
What happens when you use atomicAdd:
The hardware locks the memory location so no other thread can read or write until it’s done.
It reads the current value.
It adds the new value.
It writes the new value back.
It unlocks the location.
If another thread tries to do atomicAdd at the same address while it’s locked, it must wait.
A Simple Kernel using Atomics:
Each thread just does:
if (i < N) {
atomicAdd(global_sum, data[i]);
}
Is it correct?
Yes—the result will be correct.
What’s the problem?
It’s very slow if many threads do atomicAdd on the same memory address at the same time:
Thousands of threads try to add to global_sum at once.
Only one can succeed at a time; the others wait.
This serializes the computation—the GPU is idle most of the time, waiting for each atomic operation to finish.
As a result, parallelism is destroyed and performance drops.
When to use atomics:
They’re great if collisions are rare—for example, histogram updates where most threads update different bins.
They’re useful for debugging or for writing a very simple, baseline-correct algorithm.
For high performance with frequent updates to the same memory address, you should use methods like tree reduction with shared memory.
Softmax
In practice, the values e^xi can become enormous, leading to floating point overflow (infinity). To prevent this, We first find the maximum value in the vector, let’s call it m=max(x^j)
The formula becomes:
Kernel 1 (Find Max):
Read: The entire row from Global Memory (N elements).
Work: Perform a tree reduction to find the max.
Write: The single max value back to Global Memory.
Memory Traffic: ~4N bytes
Kernel 2 (Exponentiate):
Read: The entire row again, and the max value (N+1 elements).
Work: Compute e(x^i−m) for each element.
Write: The entire exponentiated row to a new temporary buffer in Global Memory.
Memory Traffic: ~8N bytes
Kernel 3 (Sum):
Read: The entire temporary row from Kernel 2 (N elements).
Work: Perform another tree reduction to find the sum.
Write: The single sum value back to Global Memory.
Memory Traffic: ~4N bytes
Kernel 4 (Divide):
Read: The temporary row from Kernel 2 again, and the sum value (N+1 elements).
Work: Perform the final division.
Write: The final result row to the output matrix in Global Memory.
Memory Traffic: ~8N bytes
but this is quite inefficient, think about how can we make this efficient what if we fuse this into a single kernel?
in the first kernel you store the m in shared memory of each sm, then in the same kernel you do not need to fetch xi again, you can just modify them to e^ (xi-m)
then in the same kernel you calculate sum of e^(xi-m) and store in shared memory of each sm. and then modify e^(xi-m) to the softmax
this works pretty fine until N gets too big
A100 Shared Memory: ~164 KB per SM
128k Context Window Size of row: 128,000×4 bytes=512 KB128,000×4 bytes=512 KB
now you might be thinking “but we do not need to do the whole reduction on a single sm”
actually you do need to, else you will have to write to global memory making everything incredibly slow
cool so now how do we do such a large softmax on a single SM?
the answer is Tiling
you break down the whole array of xi into small chunks, and calculate m-local, and
in a single sm. and using these we can reform the original softmax. How? that’s a homework. use some brains
so this completes basics of writing cuda kernels